Creator Analytics: What to Track on Cinely
Your AI-generated series is live. People are watching. Now what? Moving from publishing to building a sustainable creative project requires understanding what your audience is actually doing. Creator analytics on Cinely provide that clarity. The data in your Cinely Studio isn’t just a report card; it’s a roadmap. By focusing on the right signals—like unlocks versus raw views, and where your revenue comes from—you can make informed decisions that directly impact your growth and earnings. This guide breaks down the key metrics you should track and how to interpret them to refine your content strategy.
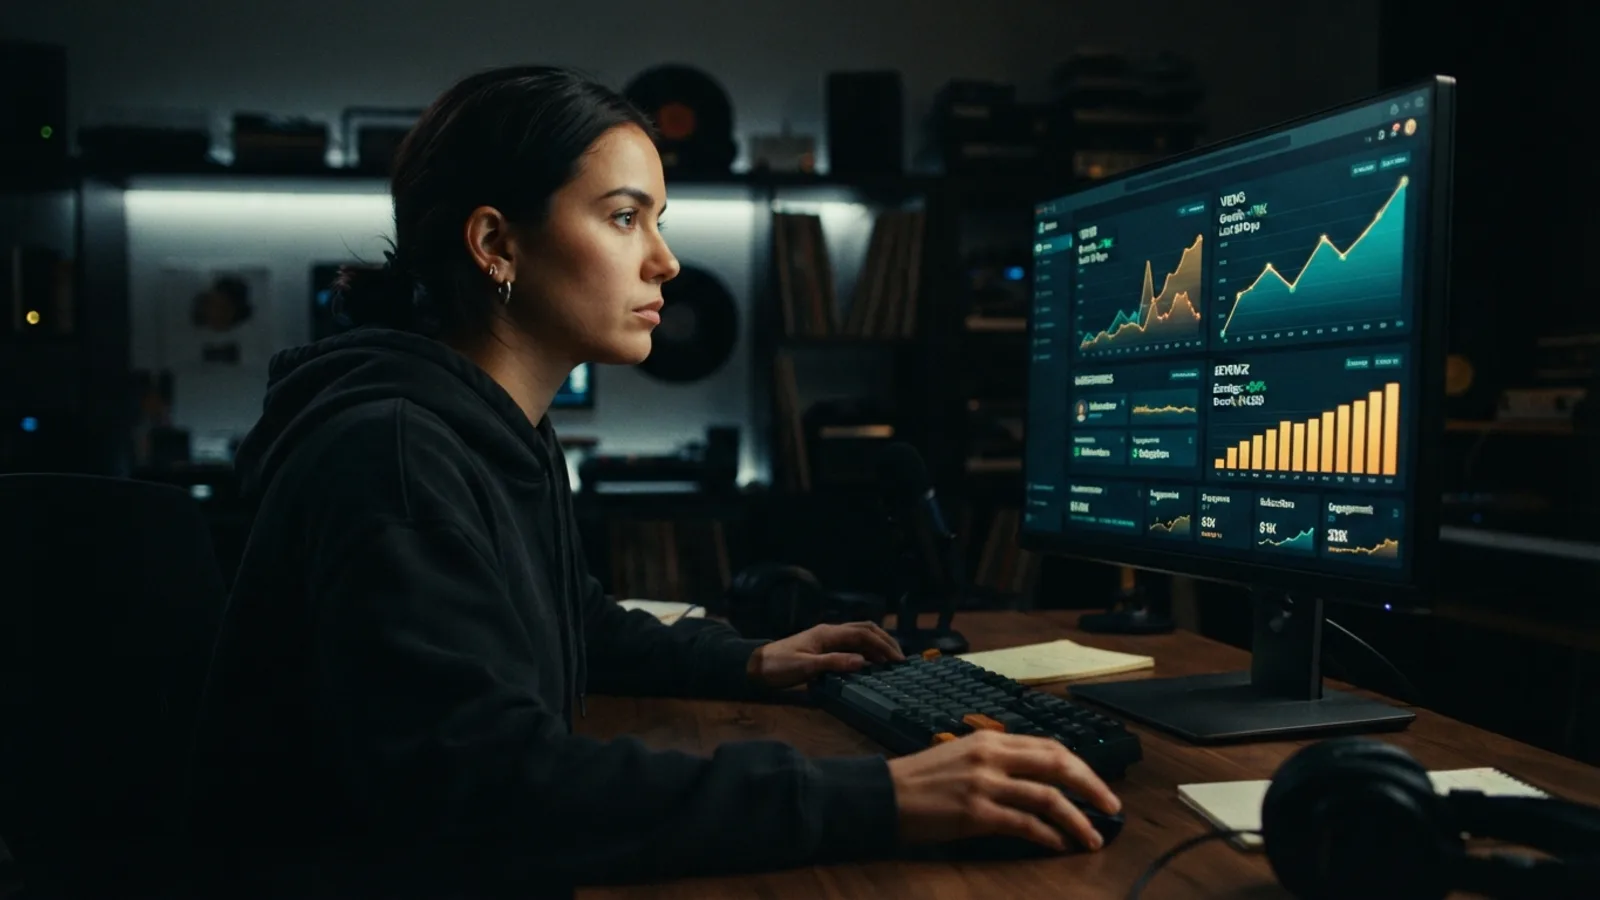
Core Metrics in Your Cinely Studio Dashboard
When you log into your Cinely Studio, you're presented with a snapshot of your performance. The primary metrics displayed are revenue, total views, total unlocks, total likes, and follower growth. These figures are calculated over selectable time ranges—7, 30, or 90 days—allowing you to spot both immediate trends and long-term momentum. Revenue is the clearest indicator of your series' commercial success, reflecting direct viewer support. Total views show your overall reach, while unlocks indicate how many viewers were engaged enough to use a coin to access an episode, a key signal of compelling content. Likes offer social proof, and follower growth measures your ability to build a returning audience. These five data points form the foundation of your analytical understanding on the platform.
Decoding Views vs. Unlocks for Episode Health
Seeing a high view count feels good, but the relationship between views and unlocks tells a deeper story. A view means someone clicked. An unlock means they committed. Because unlocking an episode costs a viewer coins they chose to buy, the unlock rate is the closest thing you have to a direct vote of confidence in your work. A high view count with a low unlock rate might suggest your series' first episode or promotional imagery is strong at attracting clicks, but the content isn’t meeting expectations to prompt further investment. Conversely, a high unlock-to-view ratio indicates your series successfully hooks viewers and delivers value, convincing them to spend coins to continue.
Consider a concrete comparison. Imagine one of your series pulls 2,000 views but only 60 unlocks—a 3% rate—while another earns 800 views and 120 unlocks, a 15% rate. The first has a discovery advantage but a commitment problem; the second is quietly outperforming it where it counts. Track this ratio for individual series on your dashboard. If a series has a low unlock rate, consider tightening your opening episode’s pacing or clarifying its hook. This metric directly informs your editing and promotional choices.
Using the Top-Series Leaderboard for Strategic Focus
Not all series perform equally, and your time and creative energy are finite. Cinely Studio features a top-series leaderboard, ranking your creations by revenue generated. This tool is invaluable for strategic focus. The series at the top of this list are your proven winners—they resonate with the audience and drive earnings. Analyze what they have in common. Is it a specific genre, like sci-fi or romance? A particular narrative structure or character archetype? By identifying these patterns, you can double down on what works. Instead of scattering efforts, use the leaderboard to decide where to invest in creating sequels, spin-offs, or similar thematic content. It turns retrospective data into a proactive content plan.
How Audience Growth Metrics Inform Your Next Move
Follower growth and recurring viewers are the metrics of sustainability. While a viral episode can spike revenue and views, steady follower growth builds a reliable audience base for your future work. Watch this metric over the 30 and 90-day ranges in your analytics. Is it trending upward? A surge in followers often correlates with a successful series launch or a consistent publishing schedule. This data helps you answer critical questions: Are you converting casual viewers into dedicated fans? Does your content have lasting appeal? Use these insights to plan engagement tactics, like teasing upcoming series to your new followers directly through the platform. Building this audience asset makes every future launch more effective.
Common Mistakes That Distort Your Read of the Data
Even with a clean dashboard, it’s easy to draw the wrong conclusions. Watch out for these traps. First, chasing raw views: views measure curiosity, not conviction, and optimizing thumbnails purely for clicks can inflate views while your unlock rate—and revenue—stays flat. Second, reading daily noise as signal: a single slow day means little, so judge changes against the 7-day trend and confirm them at 30 days before reacting. Third, changing several variables at once: if you swap your thumbnail, retitle the series, and publish a new episode in the same week, you won’t know which move caused the resulting spike or dip. Change one thing, wait, then measure. Fourth, comparing series across genres without context: audiences arrive with different expectations, so a slower-burning drama and a punchy comedy shouldn’t be judged by identical unlock rates—compare each series against its own history first. Finally, ignoring the time range you’ve selected: a 7-day window exaggerates launch spikes, while the 90-day view smooths them out. Match the window to the question you’re asking.
Translating Analytics into Actionable Creator Steps
Data is only useful if it leads to action. Here’s a practical review routine using Cinely’s creator analytics:
- Weekly: Check your Studio dashboard for the 7-day trend on your key series. Note any dips in unlock rates and flag the episode or change that preceded them.
- Monthly: Consult the top-series leaderboard. Choose one high-performing series to analyze, then use what you learn to brief your next project in the Cinely creation tools.
- Quarterly: Use the 90-day view to assess your follower growth trajectory. If it's flat, experiment with a new genre—browse the fantasy catalog or mystery catalog for inspiration—to attract a different audience segment.
- Always: Correlate revenue spikes with specific actions. Did a new episode drop, or did you change your series thumbnail? Attribution is what turns a lucky week into a repeatable tactic.
This disciplined review turns numbers into a repeatable creative process. You don’t need to be a data scientist—you just need a consistent habit of asking what the audience is telling you, and the discipline to act on the answer.
- What is the most important metric for a new Cinely creator to track first?
- Start with the unlock rate (unlocks divided by views) for your first series. It cuts through vanity metrics to show if your content is compelling enough for viewers to spend coins. A healthy unlock rate validates your concept. Then, monitor the revenue trend in your Cinely Studio dashboard to understand its direct earning potential. These two metrics give you the fastest feedback on whether to iterate or double down.
- How can I use analytics to decide what kind of series to make next?
- Your top-series leaderboard in Cinely Studio is the best tool for this. Identify your top two or three series by revenue and analyze their common traits—genre, tone, story length. Look at their audience metrics. If, for example, your [action](/explore/action) series consistently rank highest, it’s a strong signal your audience prefers that genre. Use these insights to guide your next project, creating content that aligns with proven demand.
- Can I see which specific episode in a series is performing best?
- Cinely Studio analytics report performance at the series level. To infer how a specific episode is doing, track your revenue and unlock graphs after releasing a new episode. A significant spike likely indicates strong performance for that specific installment, helping you understand what content resonates most.
Written with AI assistance and edited by the Cinely Team.